
We’ve recently taken a look at how forwards and defensemen have fared with regard to scoring chance statistics. Now, let’s take a look at goaltenders and how the Kings have done overall.
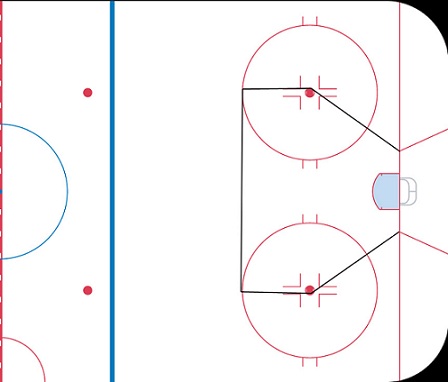
If you’re unacquainted with the scoring chance project, read more about it here. Basically, during each game I keep track of scoring chances which are generally defined by shots within this area of the ice.
People have found that there is a very heavy correlation between scoring chances and possession numbers. Yet, scoring chances are still useful in smaller samples. It’s just another layer of information we can take into account when trying to analyze a team’s performance. Also, more than anything, they are probably the most accessible entry point for people who are curious about looking into new types of hockey stats.
Now onto the numbers.
- These numbers are shots on goal that were also registered as scoring chances. Normally defined as shots within this area of the ice. League average save percentage on scoring chance shots is probably somewhere around .850.
- Of the three groups, Jonathan Bernier has the best numbers in what is also the smallest sample. His numbers are 4% better than Jonathan Quick’s overall and 3% better at even strength.
- What about bad and fluky goals? Save percentages on non-scoring chance shots was .978 for Bernier and .972 for Quick. Not very much difference there.
- On the power play, Bernier has stopped chances at .792. Quick is at .745.
- Finally, who has had the harder job? Of their overall shots, Bernier has had to try and save a scoring chance 42% of the time. Quick, 43%. At even strength there is a bit more of a difference, Bernier has had to save a scoring chance 41% of the time while Quick, at 44%, has had a slightly tougher job.
- If we had scoring chance data for every team in the league available to us, we’d probably find the Kings at the top of the rankings. 56% is a very high rate and is also in line with their league leading possession numbers.
- There has been some talk about the Kings getting off to slow starts. Their even strength chance numbers in 1st periods back that up. Their numbers in the 2nd period, on the other hand, have been staggering. It seems as though the Kings get off to groggy starts, but wake up and take over the game in the 2nd. Then in the third, when they are likely leading the game, they tighten things up.
For in-game scoring chances and bad jokes: Follow @RobertJftC